PSJC #1 Jan 9 2008
A Painless (but Quantitative) Introduction to Wavelets,
with Planetary Examples
Joe Harrington
Just as Fourier analysis did two centuries ago, wavelet analysis is
opening up entirely new ways to approach data. Fourier analysis gives
us the power spectrum of a signal. The signal is assumed to be static
and its sampling is assumed to be fundamentally periodic, like a set of
temperature sensors around a planet's equator. All variation in the
signal is assumed to be due to the static spectral content. But real
signals are rarely periodically sampled, every signal has a beginning
and an end in time, and most interesting signals change in time. After
all, we expect the power spectrum of a symphony to change as the
orchestra plays different notes! Replacing hundreds of imperfect
windowing schemes, wavelet analysis cleanly determines the
time-dependent power spectrum. Not only can you see what notes the
orchestra played, but you can determine which instruments played them,
and when. Further, wavelet analysis gives a quantitative means for
determining when a signal is aliased, and for analyzing errors. Using
this information, one can intelligently average a 2D wavelet power
spectrum in time and frequency, and produce a far better 1D power
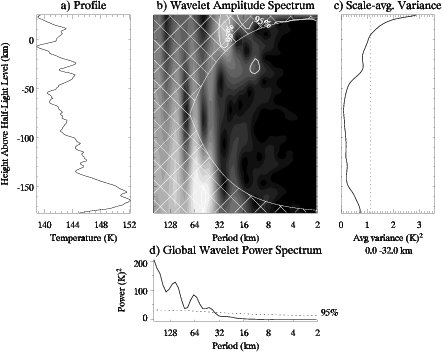
spectrum than can the Fourier transform. I present a straightforward
introductory paper on wavelets by
Torrence and Compo (1998), which
includes software in FORTRAN, IDL, and Matlab, and sample datasets.
This talk should make the paper easy to read, after which you should be
able to start using wavelet analysis on your own data. The paper and
software are available
here:
http://paos.colorado.edu/research/wavelets/ .

